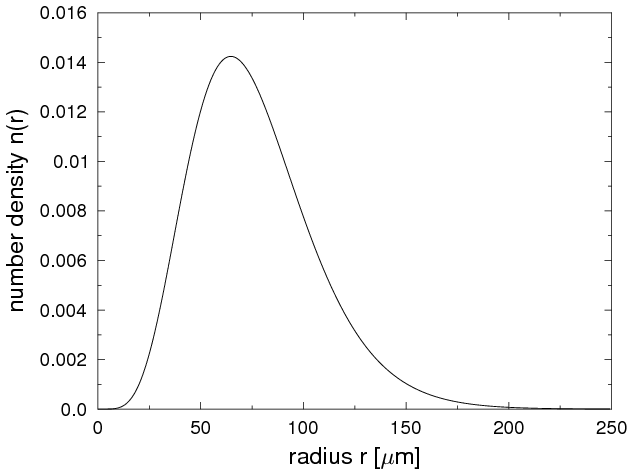
Rainbows with libRadtranTo calculate a rainbow with libRadtran is relatively straightforward. It is computationally expensive but to generate the input is quite simple. Rainbows form when we have large water droplets. For this reason we first need to calculate optical properties for a size distribution with large droplets. We may use the mie tool to do that. The input file is very short: mie_program MIEV0 refrac water mimcut 0.0000000001 nmom 10000 wavelength 380 780 wavelength_step 5. output_user netcdf r_mean 100 # ignored size_distribution_file ./sizedist_1.010 In order to get a realistic result, we need to define a size distribution on a reasonable grid (if a monodisperse distribution is assumed - that is, all droplets are same size - the result would show may spikes and individual features which cannot be observed in nature because a real cloud always includes a distribution of different droplet sizes). For our example we used a gamma distribution where the radius grid is incremented by a factor of 1.01 from wavelength to wavelength: The mie tool provides a number of optical property files in netcdf format for wavelengths between 380 and 780nm with a step of 5nm. These can be directly used as input to uvspec: atmosphere_file ../data/atmmod/afglus.dat solar_file ../data/solar_flux/atlas_plus_modtran wavelength 380 780 output rgb # translate radiance to colors, red/green/blue wc_file ./wc.dat # simple one-layer cloud, 1-2km, LWC = 1g/m2, r_eff=100 micron wc_layer wc_properties ./wc. # use the previously calculated Mie files zout 3 nstr 64 umu 0.017452 0.034899 ... # equidistant in theta, from 0 to 90 degree phi 0 And the output will be colors which can be directly converted to a picture. In this example we have the sun at the zenith and look straight downward - hence we only need the viewing zenith angle dependence and don't need to care about the azimuth. Voila! |

